Visualization
Paraver is the BSC tool for trace visualization. Trace events are encoded in Paraver format (.prv) by the Extrae tool. Paraver is a powerful tool and allows users to show many views of the trace data using different configuration files. Users can manually load, edit or create configuration files to obtain different tracing views.
The following subsections explain how to load a trace file into Paraver, open the task events view using an already predefined configuration file, and how to adjust the view to display the data properly.
For further information about Paraver, please visit the following site:
http://www.bsc.es/computer-sciences/performance-tools/paraver
Trace Loading
The final trace file in Paraver format (.prv) is at the base log folder of the application execution inside the trace folder. The fastest way to open it is calling the Paraver binary directly using the tracefile name as the argument.
$ wxparaver /path/to/trace/trace.prv
Configurations
To see the different events, counters and communications that the
runtime generates, diverse configurations are available with the COMPSs
installation. To open one of them, go to the “Load Configuration” option
in the main window and select “File”. The configuration files are under
the following path for the default installation
/opt/COMPSs/Dependencies/ paraver/cfgs/. A detailed list of all
the available configurations can be found in
Paraver: configurations.
The following guide uses the compss_tasks.cfg as an example to illustrate the basic usage of Paraver. After accepting the load of the configuration file, another window appears showing the view. Figure 24 and Figure 25 show an example of this process.
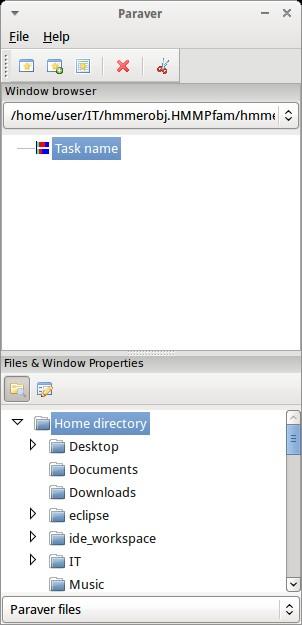
Figure 24 Paraver menu
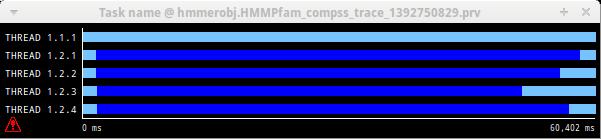
Figure 25 Trace file
View Adjustment
In a Paraver view, a red exclamation sign may appear in the bottom-left corner (see Figure 25 in the previous section). This means that some event values are not being shown (because they are out of the current view scope), so little adjustments must be made to view the trace correctly:
Fit window: modifies the view scope to fit and display all the events in the current window.
Right click on the trace window
Choose the option Fit Semantic Scale / Fit Both
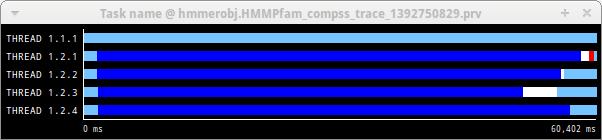
Figure 26 Paraver view adjustment: Fit window
View Event Flags: marks with a green flag all the emitted events.
Right click on the trace window
Chose the option View / Event Flags
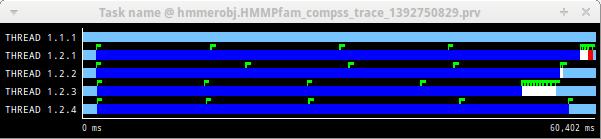
Figure 27 Paraver view adjustment: View Event Flags
Show Info Panel: display the information panel. In the tab “Colors” we can see the legend of the colors shown in the view.
Right click on the trace window
Check the Info Panel option
Select the Colors tab in the panel
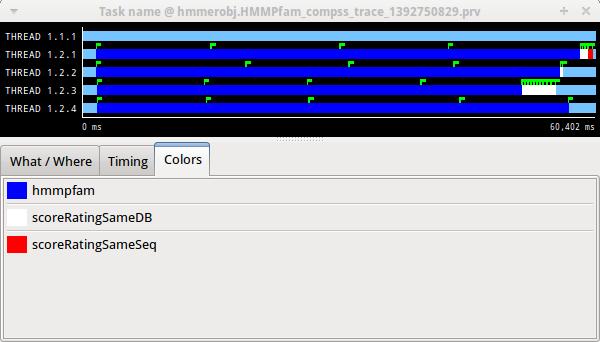
Figure 28 Paraver view adjustment: Show info panel
Zoom: explore the tracefile more in-depth by zooming into the most relevant sections.
Select a region in the trace window to see that region in detail
Repeat the previous step as many times as needed
The undo-zoom option is in the right click panel
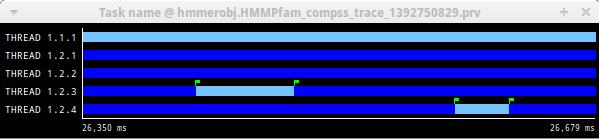
Figure 29 Paraver view adjustment: Zoom configuration
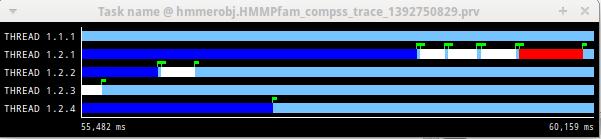
Figure 30 Paraver view adjustment: Zoom configuration