COMPSs applications tracing
COMPSs Runtime has a built-in instrumentation system to generate post-execution tracefiles of the applications’ execution. The tracefiles contain different events representing the COMPSs master state, the tasks’ execution state, and the data transfers (transfers’ information is only available when using NIO adaptor), and are useful for both visual and numerical performance analysis and diagnosis. The instrumentation process essentially intercepts and logs different events, so it adds overhead to the execution time of the application.
The tracing system uses Extrae 1 to generate tracefiles of the execution that, in turn, can be visualized with Paraver 2. Both tools are developed and maintained by the Performance Tools team of the BSC and are available on its web page http://www.bsc.es/computer-sciences/performance-tools.
For each worker node and the master, Extrae keeps track of the events in
an intermediate format file (with .mpit extension). At the end of the
execution, all intermediate files are gathered and merged with Extrae’s
mpi2prv command in order to create the final tracefile, a Paraver
format file (.prv). See the Visualization
Section for further information about the Paraver tool.
When instrumentation is activated, Extrae outputs several messages corresponding to the tracing initialization, intermediate files’ creation, and the merging process.
At present time, COMPSs tracing features two execution modes:
- Basic
Aimed at COMPSs applications developers
- Advanced
For COMPSs developers and users with access to its source code or custom installations
Next sections describe the information provided by each mode and how to use them.
Basic Mode
This mode is aimed at COMPSs’ apps users and developers. It instruments computing threads and some management resources providing information about tasks’ executions, data transfers, and hardware counters if PAPI is available (see PAPI: Hardware Counters for more info).
Basic Mode Usage
In order to activate basic tracing one needs to provide one of the following arguments to the execution command:
-t--tracing--tracing=basic--tracing=true
Example:
$ runcompss --tracing application_name application_args
When tracing is activated, Extrae generates additional output to help the user ensure that instrumentation is turned on and working without issues. On basic mode this is the output users should see when tracing is working correctly:
$ runcompss --tracing kmeans.py -n 102400000 -f 8 -d 3 -c 8 -i 10

[  INFO] Inferred PYTHON language
[  INFO] Using default location for project file: /opt/COMPSs//Runtime/configuration/xml/projects/default_project.xml
[  INFO] Using default location for resources file: /opt/COMPSs//Runtime/configuration/xml/resources/default_resources.xml
[  INFO] Using default execution type: compss

----------------- Executing kmeans.py --------------------------

Welcome to Extrae 3.8.3
Extrae: Parsing the configuration file (/opt/COMPSs//Runtime/configuration/xml/tracing/extrae_basic.xml) begins
Extrae: Warning! <trace> tag has no <home> property defined.
Extrae: Generating intermediate files for Paraver traces.

PAPI Error: Error finding event OFFCORE_RESPONSE_0:SNP_FWD, it is used in derived event PAPI_CA_ITV.
Extrae: PAPI domain set to ALL for HWC set 1
Extrae: HWC set 1 contains following counters < PAPI_TOT_INS (0x80000032) PAPI_TOT_CYC (0x8000003b) PAPI_L1_DCM (0x80000000) PAPI_L2_DCM (0x80000002) PAPI_L3_TCM (0x80000008) PAPI_BR_INS (0x80000037) PAPI_BR_MSP (0x8000002e) RESOURCE_STALLS (0x4000002f) > - never changes
Extrae: Tracing buffer can hold 100000 events
Extrae: Circular buffer disabled.
Extrae: Warning! <input-output> tag will be ignored. This library does not support instrumenting I/O calls.
Extrae: Dynamic memory instrumentation is disabled.
Extrae: Basic I/O memory instrumentation is disabled.
Extrae: System calls instrumentation is disabled.
Extrae: Parsing the configuration file (/opt/COMPSs//Runtime/configuration/xml/tracing/extrae_basic.xml) has ended
Extrae: Intermediate traces will be stored in /home/user/temp/documentation
Extrae: Tracing mode is set to: Detail.
Extrae: Error! Hardware counter PAPI_BR_INS (0x80000037) cannot be added in set 1 (task 0, thread 0)
Extrae: Error! Hardware counter PAPI_BR_MSP (0x8000002e) cannot be added in set 1 (task 0, thread 0)
Extrae: Error! Hardware counter RESOURCE_STALLS (0x4000002f) cannot be added in set 1 (task 0, thread 0)
Extrae: Successfully initiated with 1 tasks and 1 threads


PAPI Error: Error finding event OFFCORE_RESPONSE_0:SNP_FWD, it is used in derived event PAPI_CA_ITV.
Extrae: Error! Hardware counter PAPI_BR_INS (0x80000037) cannot be added in set 1 (task 0, thread 0)
Extrae: Error! Hardware counter PAPI_BR_MSP (0x8000002e) cannot be added in set 1 (task 0, thread 0)
Extrae: Error! Hardware counter RESOURCE_STALLS (0x4000002f) cannot be added in set 1 (task 0, thread 0)
pyextrae: Loading tracing library 'libseqtrace.so'
WARNING: COMPSs Properties file is null. Setting default values
Loading LoggerManager
[(419)    API]  -  Starting COMPSs Runtime v2.9.rc2107 (build 20210720-1547.r81bdafc6f06a7680a344ae434a467473ecbaf27e)
Generation/Load done
Starting kmeans
Doing iteration #1/10
Doing iteration #2/10
Doing iteration #3/10
Doing iteration #4/10
Doing iteration #5/10
Doing iteration #6/10
Doing iteration #7/10
Doing iteration #8/10
Doing iteration #9/10
Doing iteration #10/10
Ending kmeans
-----------------------------------------
-------------- RESULTS ------------------
-----------------------------------------
Initialization time: 55.369870
Kmeans time: 117.859757
Total time: 173.229627
-----------------------------------------
CENTRES:
[[0.69757475 0.74511351 0.48157611]
[0.54683653 0.20274669 0.2117475 ]
[0.24194863 0.74448094 0.75633981]
[0.21854362 0.67072938 0.23273541]
[0.77272546 0.68522249 0.16245965]
[0.22683962 0.23359743 0.67203863]
[0.75351606 0.73746265 0.83339847]
[0.75838884 0.23805883 0.71538748]]
-----------------------------------------
Extrae: Intermediate raw trace file created : /home/user/temp/documentation/set-0/TRACE@linux-2e63.0000027029000000000002.mpit
Extrae: Intermediate raw trace file created : /home/user/temp/documentation/set-0/TRACE@linux-2e63.0000027029000000000001.mpit
Extrae: Intermediate raw trace file created : /home/user/temp/documentation/set-0/TRACE@linux-2e63.0000027029000000000000.mpit
Extrae: Intermediate raw sym file created : /home/user/temp/documentation/set-0/TRACE@linux-2e63.0000027029000000000000.sym
Extrae: Deallocating memory.
Extrae: Application has ended. Tracing has been terminated.
merger: Output trace format is: Paraver
merger: Extrae 3.8.3
mpi2prv: Assigned nodes < linux-2e63 >
mpi2prv: Assigned size per processor < 1 Mbytes >
mpi2prv: File set-0/TRACE@linux-2e63.0000027148000001000000.mpit is object 1.2.1 on node linux-2e63 assigned to processor 0
mpi2prv: File set-0/TRACE@linux-2e63.0000027148000001000001.mpit is object 1.2.2 on node linux-2e63 assigned to processor 0
mpi2prv: File set-0/TRACE@linux-2e63.0000027148000001000002.mpit is object 1.2.3 on node linux-2e63 assigned to processor 0
mpi2prv: File set-0/TRACE@linux-2e63.0000027148000001000003.mpit is object 1.2.4 on node linux-2e63 assigned to processor 0
mpi2prv: File set-0/TRACE@linux-2e63.0000027148000001000004.mpit is object 1.2.5 on node linux-2e63 assigned to processor 0
mpi2prv: File set-0/TRACE@linux-2e63.0000027148000001000005.mpit is object 1.2.6 on node linux-2e63 assigned to processor 0
mpi2prv: File set-0/TRACE@linux-2e63.0000027148000001000006.mpit is object 1.2.7 on node linux-2e63 assigned to processor 0
mpi2prv: File set-0/TRACE@linux-2e63.0000027029000000000000.mpit is object 1.1.1 on node linux-2e63 assigned to processor 0
mpi2prv: File set-0/TRACE@linux-2e63.0000027029000000000001.mpit is object 1.1.2 on node linux-2e63 assigned to processor 0
mpi2prv: File set-0/TRACE@linux-2e63.0000027029000000000002.mpit is object 1.1.3 on node linux-2e63 assigned to processor 0
mpi2prv: A total of 8 symbols were imported from TRACE.sym file
mpi2prv: 0 function symbols imported
mpi2prv: 8 HWC counter descriptions imported
mpi2prv: Checking for target directory existence... exists, ok!
mpi2prv: Selected output trace format is Paraver
mpi2prv: Stored trace format is Paraver
mpi2prv: Searching synchronization points... done
mpi2prv: Time Synchronization disabled.
mpi2prv: Circular buffer enabled at tracing time? NO
mpi2prv: Parsing intermediate files
mpi2prv: Progress 1 of 2 ... 5% 10% 15% 20% 25% 30% 35% 40% 45% 50% 55% 60% 65% 70% 75% 80% 85% 90% 95% done
mpi2prv: Processor 0 succeeded to translate its assigned files
mpi2prv: Elapsed time translating files: 0 hours 0 minutes 0 seconds
mpi2prv: Elapsed time sorting addresses: 0 hours 0 minutes 0 seconds
mpi2prv: Generating tracefile (intermediate buffers of 671078 events)
     This process can take a while. Please, be patient.
mpi2prv: Progress 2 of 2 ... 5% 10% 15% 20% 25% 30% 35% 40% 45% 50% 55% 60% 65% 70% 75% 80% 85% 90% 95% done
mpi2prv: Elapsed time merge step: 0 hours 0 minutes 0 seconds
mpi2prv: Resulting tracefile occupies 664068 bytes
mpi2prv: Removing temporal files... mpi2prv: Warning! Clock accuracy seems to be in microseconds instead of nanoseconds.
done
mpi2prv: Elapsed time removing temporal files: 0 hours 0 minutes 0 seconds
mpi2prv: Congratulations! ./trace/kmeans.py_compss.prv has been generated.
[(189793)    API]  -  Execution Finished

------------------------------------------------------------
The output contains diverse information about the tracing, for example, Extrae
version used (VERSION will be replaced by the actual number during
executions), the XML configuration file used (/opt/COMPSs/Runtime/configuration/xml/tracing/extrae_basic.xml
– if using python, the extrae_python_worker.xml located in the same folder will be used in the workers), the
amount of threads instrumented (objects through 1.1.1 to 1.2.7),
available hardware counters (PAPI_TOT_INS (0x80000032) …
PAPI_L3_TCM (0x80000008) ) or the name of the generated tracefile
(./trace/ kmeans.py_compss.prv). When using
NIO communications adaptor with debug activated, the log of each worker
also contains the Extrae initialization information.
Tip
The extrae configuration files used in basic mode are:
$COMPSS_HOME/Runtime/configuration/xml/tracing/extrae_basic.xml$COMPSS_HOME/Runtime/configuration/xml/tracing/extrae_python_worker.xml(when using Python)
Tip
Figure 22 was generated with this execution.
Important
COMPSs needs to perform an extra merging step when using Python in order to add the Python-produced events to the main tracefile. If Python events are not shown, check runtime.log file and search for the following expected output of this merging process to find possible errors:
[(189467)(2021-07-21 08:09:33,292)             Tracing]    @teMasterPackage  -  Tracing: generating master package: package
[(189468)(2021-07-21 08:09:33,293)             Tracing]    @run              -  Starting stream goobler
[(189469)(2021-07-21 08:09:33,294)             Tracing]    @run              -  Starting stream goobler
[(189501)(2021-07-21 08:09:33,326)             Tracing]    @erMasterPackage  -  Tracing: Transferring master package
[(189503)(2021-07-21 08:09:33,328)             Tracing]    @generateTrace    -  Tracing: Generating trace with mode gentrace
[(189503)(2021-07-21 08:09:33,328)             Tracing]    @run              -  Starting stream goobler
[(189504)(2021-07-21 08:09:33,329)             Tracing]    @run              -  Starting stream goobler
[(189589)(2021-07-21 08:09:33,414)             Tracing]    @<init>           -  Trace's merger initialization successful
[(189589)(2021-07-21 08:09:33,414)             Tracing]    @umAndSyncEvents  -  Parsing master sync events
[(189589)(2021-07-21 08:09:33,414)             Tracing]    @getSyncEvents    -  Getting sync events from: /home/user/.COMPSs/kmeans.py_01/trace/kmeans.py_compss.prv for worker -1
[(189745)(2021-07-21 08:09:33,570)             Tracing]    @umAndSyncEvents  -  Merging task traces into master which contains 1 lines.
[(189745)(2021-07-21 08:09:33,570)             Tracing]    @umAndSyncEvents  -  Merging worker /home/user/.COMPSs/kmeans.py_01/trace/python/1_python_trace.prv
[(189745)(2021-07-21 08:09:33,570)             Tracing]    @getWorkerEvents  -  Getting worker events from: /home/user/.COMPSs/kmeans.py_01/trace/python/1_python_trace.prv
[(189751)(2021-07-21 08:09:33,576)             Tracing]    @getSyncEvents    -  Getting sync events from: /home/user/.COMPSs/kmeans.py_01/trace/python/1_python_trace.prv for worker 2
[(189852)(2021-07-21 08:09:33,677)             Tracing]    @iteWorkerEvents  -  Writing 4089 lines from worker 2 with 4 threads
[(189872)(2021-07-21 08:09:33,697)             Tracing]    @ardwareCounters  -  Merging PCF Hardware Counters into master
[(189872)(2021-07-21 08:09:33,697)             Tracing]    @getHWCounters    -  Getting pcf hw counters from: /home/user/.COMPSs/kmeans.py_01/trace/kmeans.py_compss.pcf
[(189872)(2021-07-21 08:09:33,697)             Tracing]    @getHWCounters    -  Getting pcf hw counters from: /home/user/.COMPSs/kmeans.py_01/trace/python/1_python_trace.pcf
[(189873)(2021-07-21 08:09:33,698)             Tracing]    @ardwareCounters  -  Analised worker had 0 lines to be included
[(189873)(2021-07-21 08:09:33,698)             Tracing]    @ardwareCounters  -  No hardware counters to include in PCF.
[(189873)(2021-07-21 08:09:33,698)             Tracing]    @merge            -  Merging finished.
[(189873)(2021-07-21 08:09:33,698)             Tracing]    @updateThreads    -  Tracing: Updating thread labels
[(189914)(2021-07-21 08:09:33,739)             Tracing]    @latedPrvThreads  -  Tracing: Updating thread identifiers in .prv file
[(189959)(2021-07-21 08:09:33,784)             Tracing]    @anMasterPackage  -  Tracing: Removing tracing master package: /home/user/documentation/master_compss_trace.tar.gz
[(189959)(2021-07-21 08:09:33,784)             Tracing]    @anMasterPackage  -  Deleted master tracing package.
Instrumented Threads in Basic Mode
Basic traces instrument the following threads:
Master node (3 threads)
COMPSs runtime (main application thread)
Access Processor thread
Task Dispatcher thread
Worker node (3 + Computing Units)
Worker main thread
Worker File system thread
Worker timer thread
Number of threads available for computing
Information Available in Basic Traces
The basic mode tracefiles contain three kinds of information:
- Events
Marking diverse situations such as the runtime start, tasks’ execution or synchronization points.
- Communications
Showing the transfers and requests of the parameters needed by COMPSs tasks.
- Hardware counters
Of the execution obtained with Performance API (see PAPI: Hardware Counters)
Basic Trace Example
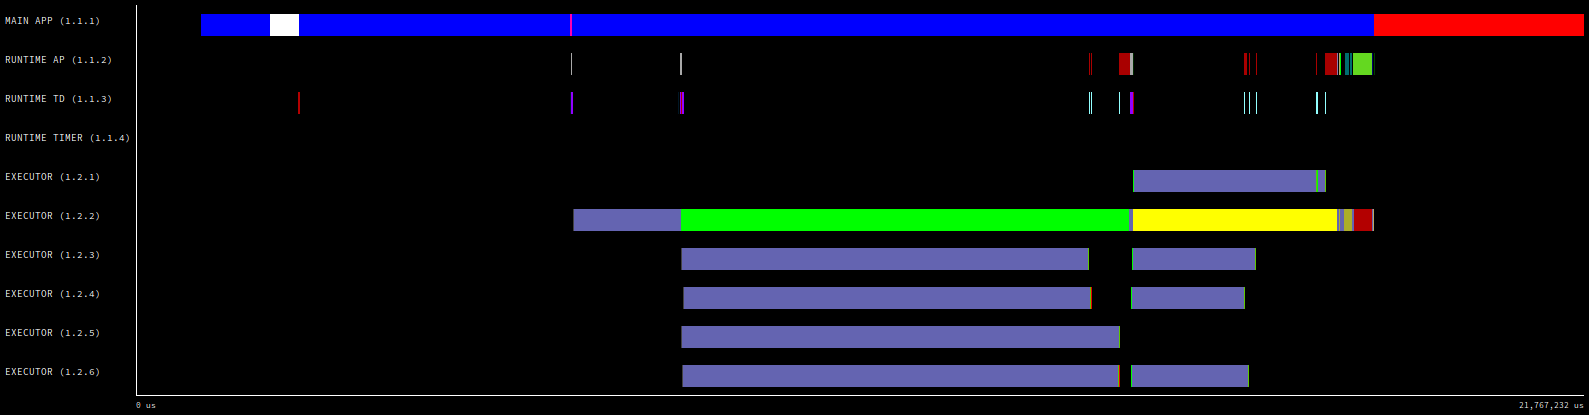
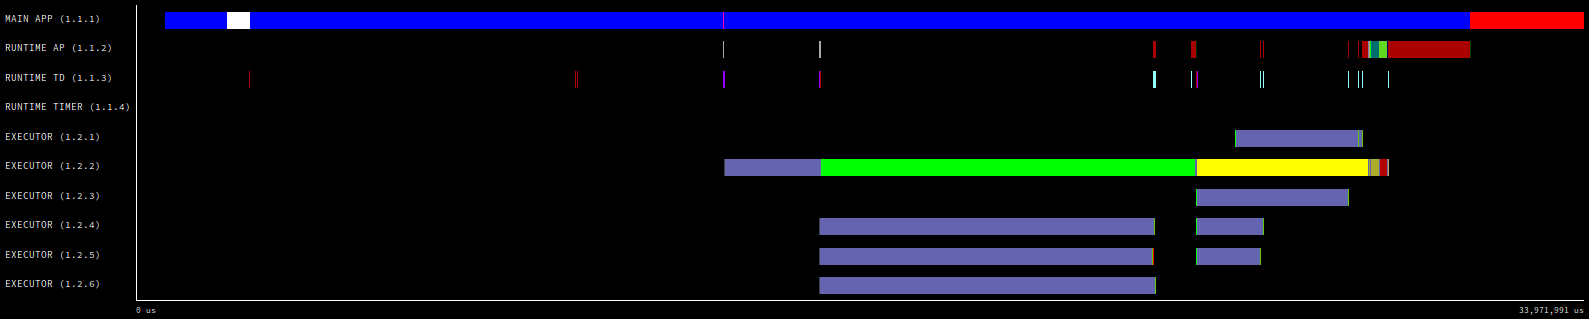
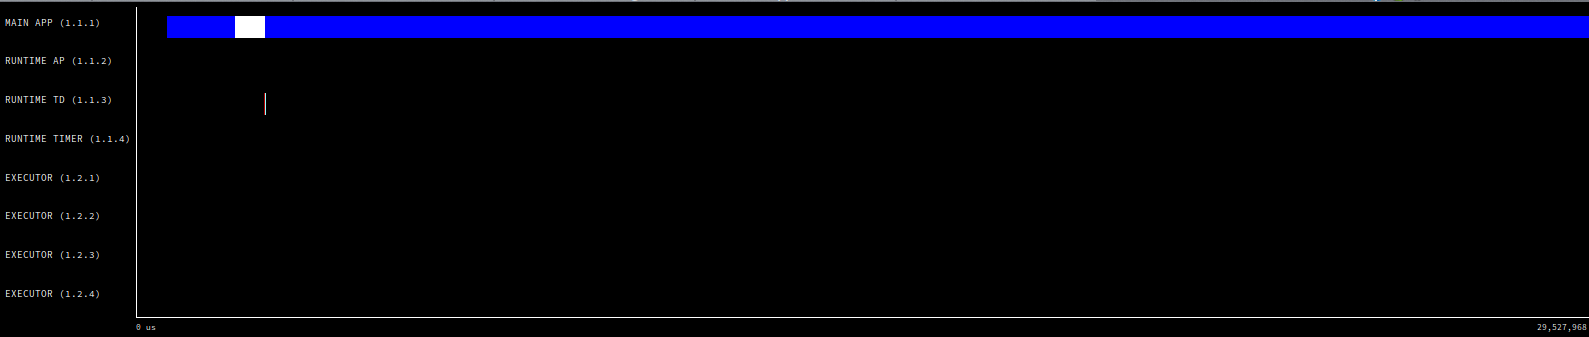
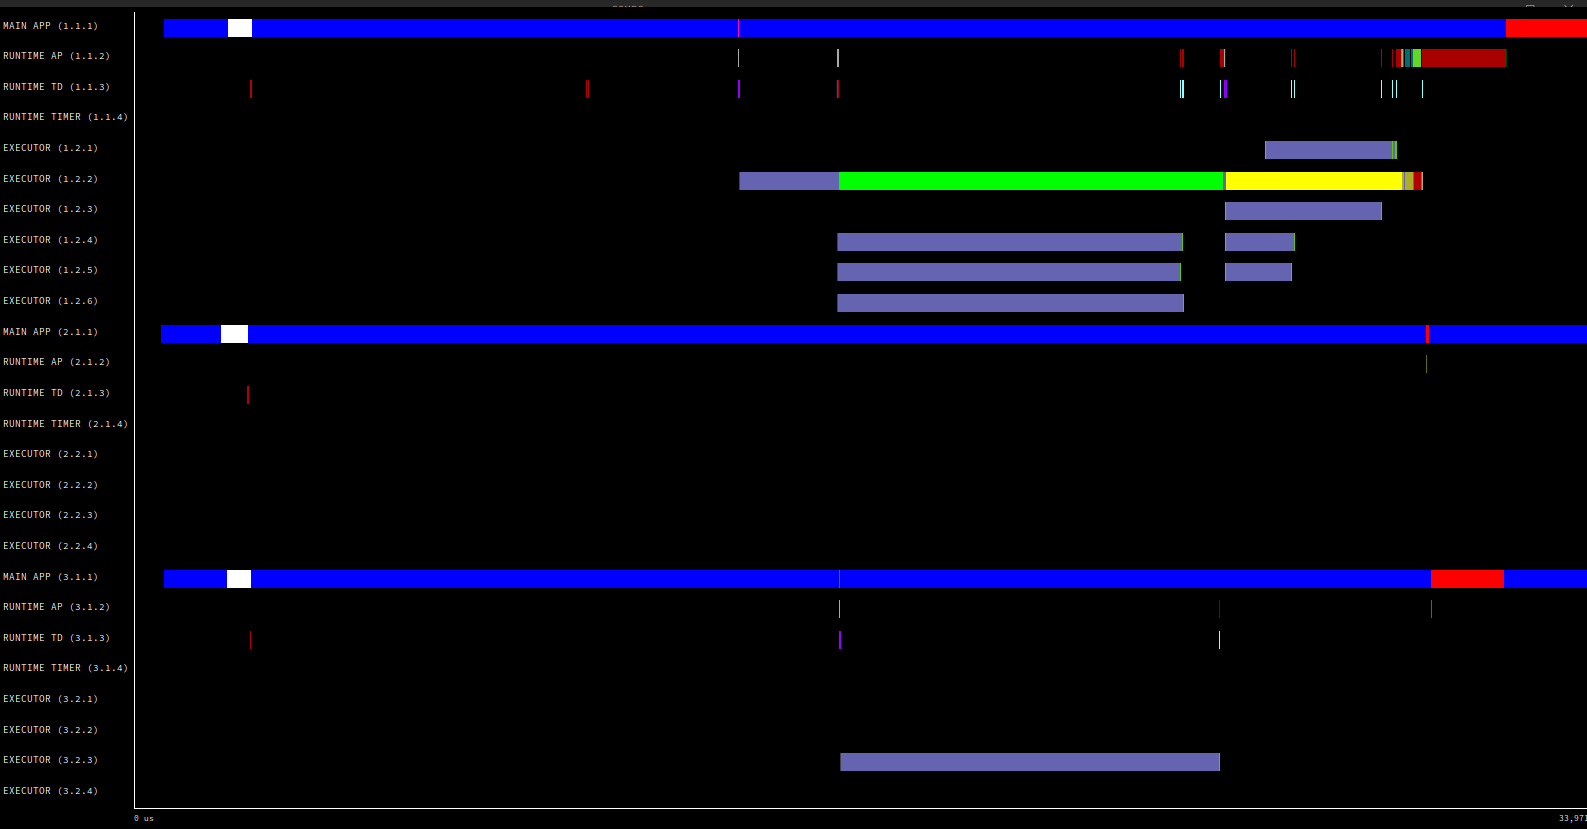
Figure 22 is a tracefile generated by the execution of a k-means clustering algorithm. Each timeline contains information of a different resource, and each event’s name is on the legend. Depending on the number of computing threads specified for each worker, the number of timelines varies. However the following threads are always shown:
- Master - Thread 1.1.1
This timeline shows the actions performed by the main thread of the COMPSs application
- Access Processor - Thread 1.1.2
All the events related to the tasks’ parameters management, such as dependencies or transfers are shown in this thread.
- Task Dispatcher - Thread 1.1.3
Shows information about the state and scheduling of the tasks to be executed.
- Worker X Master - Thread X.1.1
This thread is the master of each worker and handles the computing resources and transfers. It is repeated for each available resource. All data events of the worker, such as requests, transfers and receives are marked on this timeline (when using the appropriate configurations).
- Worker X File system - Thread X.1.2
This thread manages the synchronous file system operations (e.g. copy file) performed by the worker.
- Worker X Timer - Thread X.1.3
This thread manages the cancellation of the tasks when the wall-clock limit is reached.
- Worker X Executor Y - Thread X.2.Y
Shows the actual tasks execution information and is repeated as many times as computing threads has the worker X
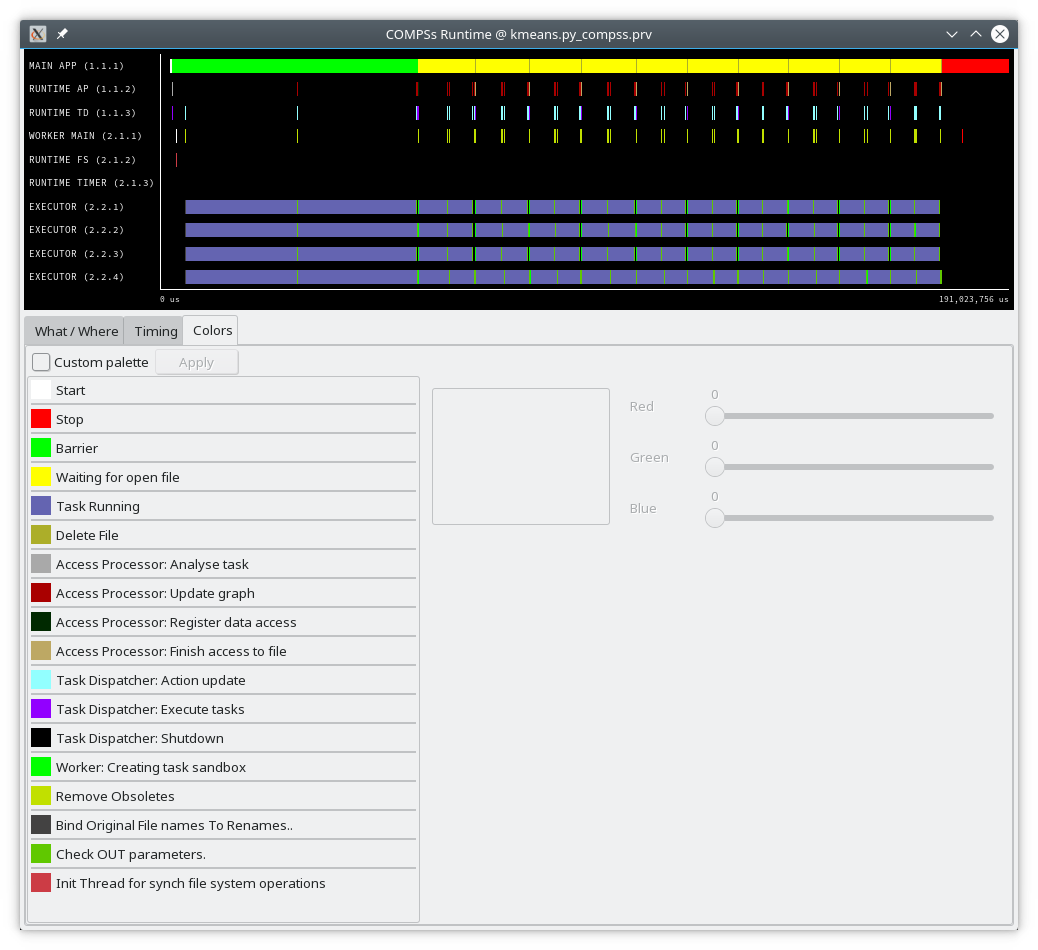
Figure 22 Basic mode tracefile for a k-means algorithm visualized with compss_runtime.cfg
Advanced Mode
This mode is for more advanced COMPSs’ users and developers who want to customize further the information provided by the tracing or need rawer information like pthreads calls or Java garbage collection. With it, every single thread created during the execution is traced.
Important
The extra information provided by the advanced mode is only available on the workers when using NIO adaptor.
Advanced Mode Usage
In order to activate the advanced tracing add the following option to the execution:
--tracing=advanced
Example:
$ runcompss --tracing=advanced application_name application_args
When advanced tracing is activated, the configuration file reported on
the output is $COMPSS_HOME/Runtime/configuration/xml/tracing/extrae_advanced.xml.
$ runcompss --tracing=advanced kmeans.py -n 102400000 -f 8 -d 3 -c 8 -i 10

[  INFO] Inferred PYTHON language
[  INFO] Using default location for project file: /opt/COMPSs//Runtime/configuration/xml/projects/default_project.xml
[  INFO] Using default location for resources file: /opt/COMPSs//Runtime/configuration/xml/resources/default_resources.xml
[  INFO] Using default execution type: compss

----------------- Executing kmeans.py --------------------------

Welcome to Extrae 3.8.3
Extrae: Parsing the configuration file (/opt/COMPSs//Runtime/configuration/xml/tracing/extrae_advanced.xml) begins
...
...
...
This is the default file used for advanced tracing as well as
extrae_python_worker.xml if using Python.
However, advanced users can modify it in order to customize the information
provided by Extrae. The configuration file is read first by the master on the
runcompss script. When using NIO adaptor for communication, the
configuration file is also read when each worker is started (on
persistent_worker.sh or persistent_worker_starter.sh depending on
the execution environment).
Tip
The extrae configuration files used in advanced mode are:
$COMPSS_HOME/Runtime/configuration/xml/tracing/extrae_advanced.xml$COMPSS_HOME/Runtime/configuration/xml/tracing/extrae_python_worker.xml(when using Python)
Tip
Figure 23 was generated with this execution.
If the extrae_advanced.xml file is modified, the changes always affect the
master, and also the workers when using NIO. Modifying the scripts which turn
on the master and the workers is possible to achieve different
instrumentations for master/workers. However, not all Extrae available
XML configurations work with COMPSs, some of them can make the runtime
or workers crash so modify them at your discretion and risk. More
information about instrumentation XML configurations on Extrae User
Guide at:
https://www.bsc.es/computer-sciences/performance-tools/trace-generation/extrae/extrae-user-guide.
Instrumented Threads in Advanced Mode
Advanced mode instruments all the pthreads created during the application execution. It contains all the threads shown on basic traces plus extra ones used to call command-line commands, I/O streams managers and all actions which create a new process. Due to the temporal nature of many of this threads, they may contain little information or appear just at specific parts of the execution pipeline.
Information Available in Advanced Traces
The advanced mode tracefiles contain the same information as the basic ones:
- Events
Marking diverse situations such as the runtime start, tasks’ execution or synchronization points.
- Communications
Showing the transfers and requests of the parameters needed by COMPSs tasks.
- Hardware counters
Of the execution obtained with Performance API (see PAPI: Hardware Counters)
Advanced Trace Example
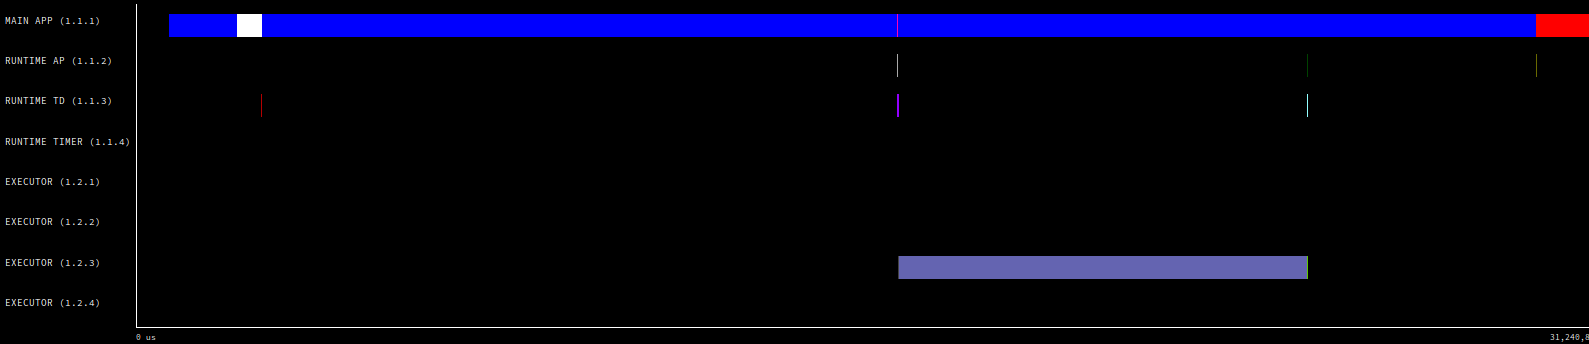
Figure 23 shows the total completed instructions for a sample program executed with the advanced tracing mode. Note that the thread - resource correspondence described on the basic trace example is no longer static and thus cannot be inferred. Nonetheless, they can be found thanks to the named events shown in other configurations such as compss_runtime.cfg.
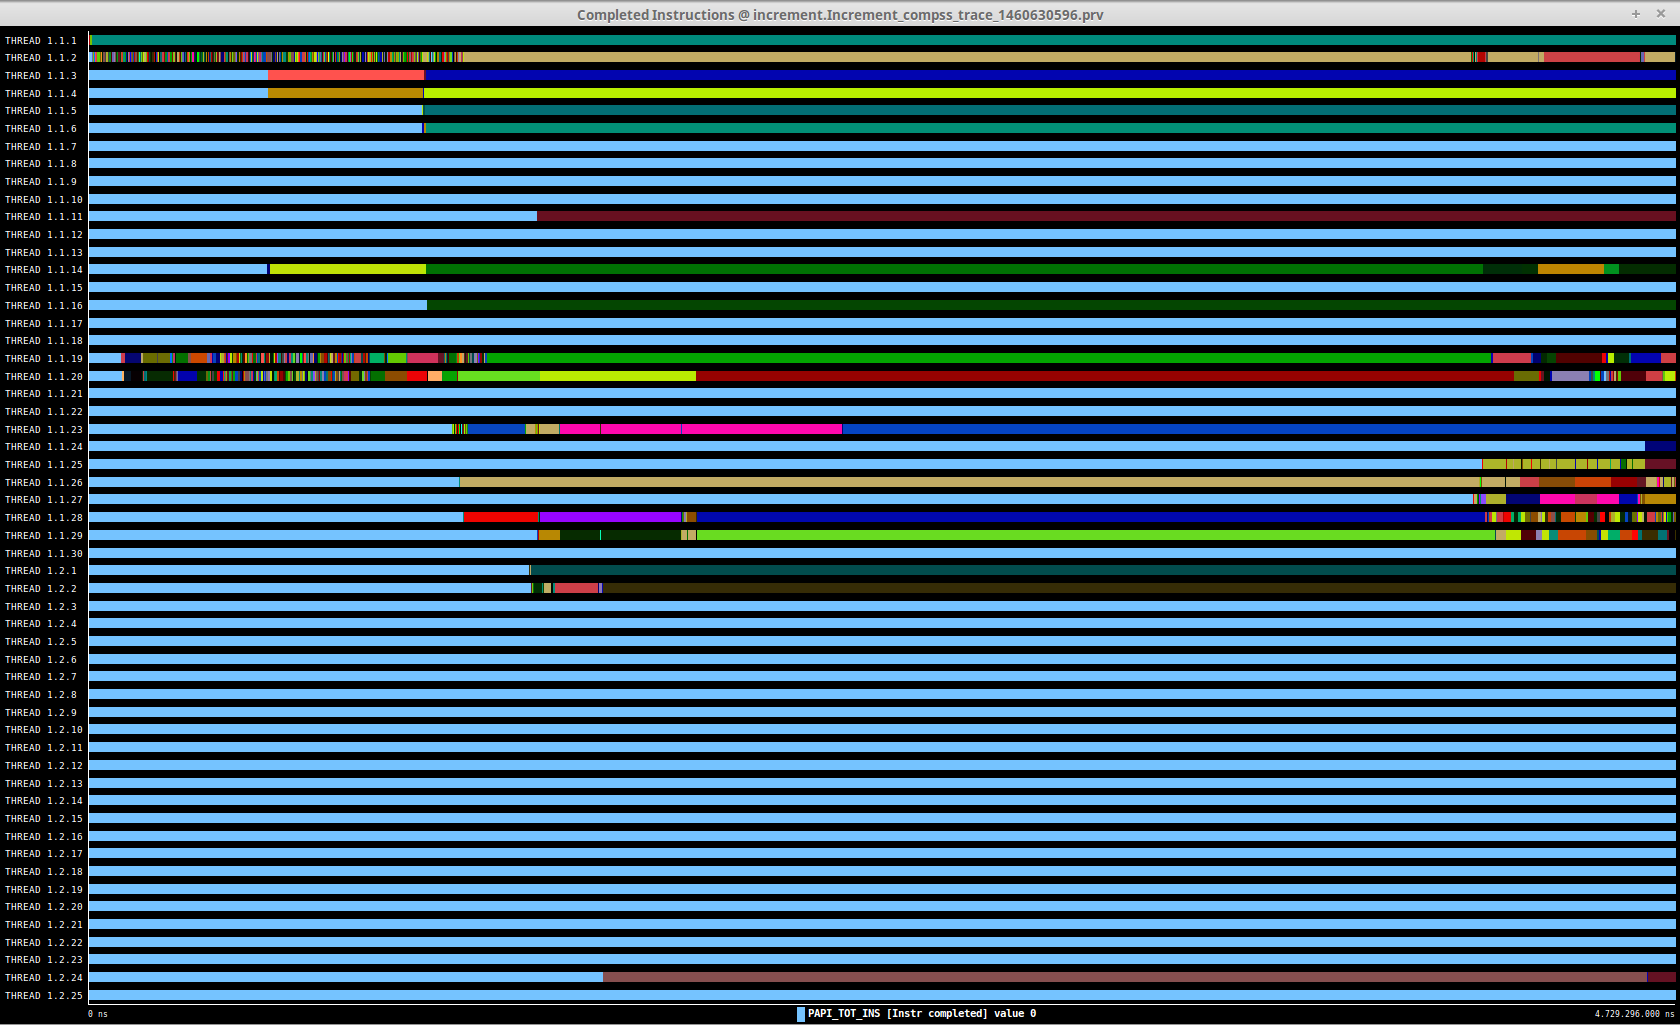
Figure 23 Advanced mode tracefile for a testing program showing the total completed instructions
For further information about Extrae, please visit the following site:
Trace for Agents
Applications deployed as COMPSs Agents can also be traced. Unlike master-worker COMPSs applications, where the trace contains the events for all the nodes within the infrastructure, with the Agents approach, each Agent generates its own trace.
To activate the tracing – either basic or advanced mode –, the compss_agent_start
command allows the -t, --tracing and --tracing=<level> options with the
same meaning as with the master-worker approach. For example:
$ compss_agent_start \
    --hostname="COMPSsWorker01" \
    --pythonpath="~/python/path" \
    --log_dir="~/agent1/log" \
    --rest_port="46101" \
    --comm_port="46102" \
    -d -t \
    --project="~/project.xml" \
    --resources="~/resources.xml"&
Upon the completion of an operation submitted with the --stop flag, the agent stops
and generates a trace folder within his log folder, containing the prv, pcf and row files.
$ compss_agent_call_operation" \
  --lang="PYTHON" \
  --master_node="127.0.0.1" \
  --master_port="46101" \
  --method_name="kmeans" \
  --stop \
  "kmeans"
When multiple agents are involved in an application’s execution, the stop command must be forwarded to all the other agents with the --forward parameter.
$ compss_agent_call_operation" \
    --lang="PYTHON" \
    --master_node="127.0.0.1" \
    --master_port="46101" \
    --method_name="kmeans" \
    --stop \
    --forward_to="COMPSsWorker02:46201;COMPSsWorker03:46301" \
    "kmeans"
Upon the completion of the last operation submitted and the shutdown of all involved agents, all agent will have generated their own individual trace.
In order to merge this traces the script compss_agent_merge_traces can be used.
The script takes as parameters the folders of the log dirs of the agents with the traces to merge.
$ compss_agent_merge_traces -h
/opt/COMPSs/Runtime/scripts/user/compss_agent_merge_traces <options> <log_dir1> <log_dir2> <log_dir3> ...

Merges the traces of the specified agents into a new trace created at the directory <output_dir>

options:
        -h/--help                                       shows this message

        --output_dir=<output_dir>                       the directory where to store the merged traces

        -f/--force_override                             overrides output_dir if it already exists without asking

        --result_trace_name=<result_trace_name>         the name of the generated trace
Usage example:
$ compss_agent_merge_traces \
    --result_trace_name=merged_kmeans \
    ~/.COMPSs/1agent_python3_01/agent1 \
    ~/.COMPSs/1agent_python3_01/agent2 \
    ~/.COMPSs/1agent_python3_01/agent3
The script will put the merged trace in the specified output_dir or in the current directory inside a folder named compss_agent_merge_traces by default
Custom Installation and Configuration
Custom Extrae
COMPSs uses the environment variable EXTRAE_HOME to get the
reference to its installation directory (by default:
/opt/COMPSs/Dependencies/extrae ). However, if the variable is
already defined once the runtime is started, COMPSs will not override
it. User can take advantage of this fact in order to use custom extrae
installations. Just set the EXTRAE_HOME environment variable to
the directory where your custom package is, and make sure that it is
also set for the worker’s environment.
Be aware that using different Extrae packages can break the runtime
and executions so you may change it at your own risk.
Custom Configuration file
COMPSs offers the possibility to specify an extrae custom configuration file in order to harness all the tracing capabilities further tailoring which information about the execution is displayed (except for Python workers). To do so just indicate the file as an execution parameter as follows:
--extrae_config_file=/path/to/config/file.xml
In addition, there is also the possibility to specify an extrae custom configuration file for the Python workers as follows:
--extrae_config_file_python=/path/to/config/file_python.xml
The configuration files must be in a shared disk between all COMPSs workers because a file’s copy is not distributed among them, just the path to that file.
Tip
The default configuration files are in:
$COMPSS_HOME/Runtime/configuration/xml/tracing/extrae_advanced.xml$COMPSS_HOME/Runtime/configuration/xml/tracing/extrae_python_worker.xml(when using Python)
The can be taken as base for customization.
- 1
For more information: https://www.bsc.es/computer-sciences/extrae
- 2
For more information: https://www.bsc.es/computer-sciences/performance-tools/paraver