Task Dependency Graph
COMPSs can generate a task dependency graph from an executed code. It is indicating by a
$ runcompss -g /home/compss/tutorial_apps/c/matmul_objects/master/Matmul 3 4 2.0
The generated task dependency graph is stored within the
$HOME/.COMPSs/<APP_NAME>_<00-99>/monitor directory in dot format.
The generated graph is complete_graph.dot file, which can be
displayed with any dot viewer. COMPSs also provides the compss_gengraph script
which converts the given dot file into pdf.
$ cd $HOME/.COMPSs/Matmul_02/monitor
$ compss_gengraph complete_graph.dot
$ evince complete_graph.pdf  # or use any other pdf viewer you like
The following figure depicts the task dependency graph for the Matmul application in its object version with 3x3 blocks matrices, each one containing a 4x4 matrix of doubles. Each block in the result matrix accumulates three block multiplications, i.e. three multiplications of 4x4 matrices of doubles.
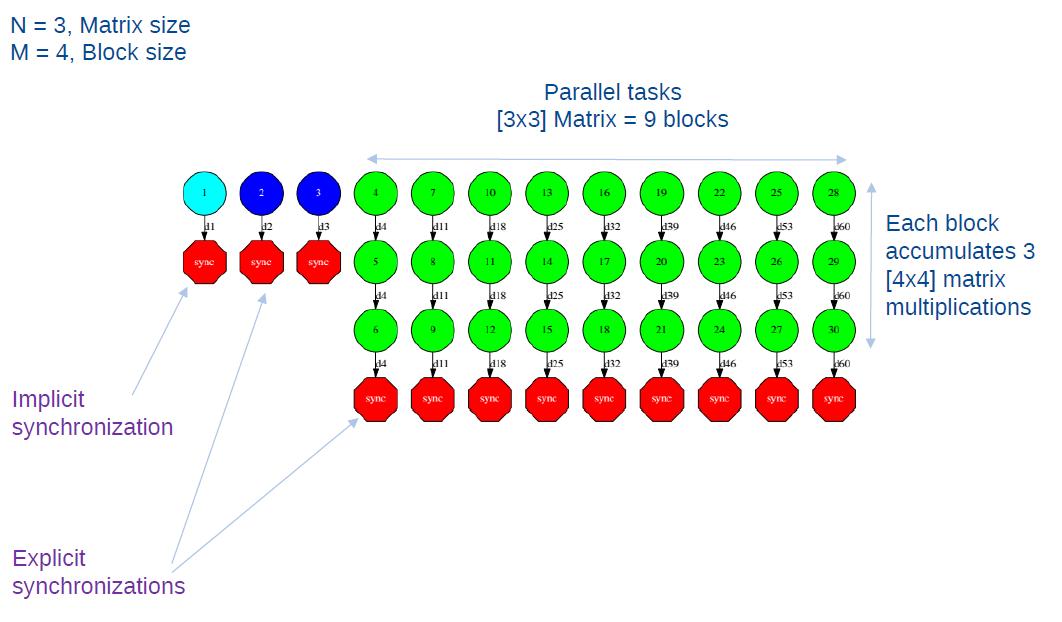
Figure 12 Matmul Execution Graph.
The light blue circle corresponds to the initialization of matrix “A” by means of a method-task and it has an implicit synchronization inside. The dark blue circles correspond to the other two initializations by means of function-tasks; in this case the synchronizations are explicit and must be provided by the developer after the task call. Both implicit and explicit synchronizations are represented as red circles.
Each green circle is a partial matrix multiplication of a set of 3. One block from matrix “A” and the correspondent one from matrix “B”. The result is written in the right block in “C” that accumulates the partial block multiplications. Each multiplication set has an explicit synchronization. All green tasks are method-tasks and they are executed in parallel.