Memory Profiling
COMPSs also provides a mechanism to show the memory usage over time when running Python applications. This is particularly useful when memory issues happen (e.g. memory exhausted – causing the application crash), or performance analysis (e.g. problem size scalability).
To this end, the runcompss and enqueue_compss commands provide the
--python_memory_profile flag, which provides a set of files (one per node used
in the application execution) where the memory used during the execution is
recorded at the end of the application.
They are generated in the same folder where the execution has been launched.
Important
The memory-profiler and psutil packages are mandatory in order to
use the --python_memory_profile flag.
It can be easily installed with pip:
$ python -m pip install psutil memory-profiler --user
Tip
If you want to store from the memory profiler in a different folder, export
the COMPSS_WORKER_PROFILE_PATH with the destination path:
$ export COMPSS_WORKER_PROFILE_PATH=/path/to/destination
When --python_memory_profile is included, a file with name
mprofile_<DATE_TIME>.dat is generated for the master memory profiling,
while for the workers they are named <WORKER_NODE_NAME>.dat.
These files can be displayed with the mprof tool:
$ mprof plot <FILE>.dat
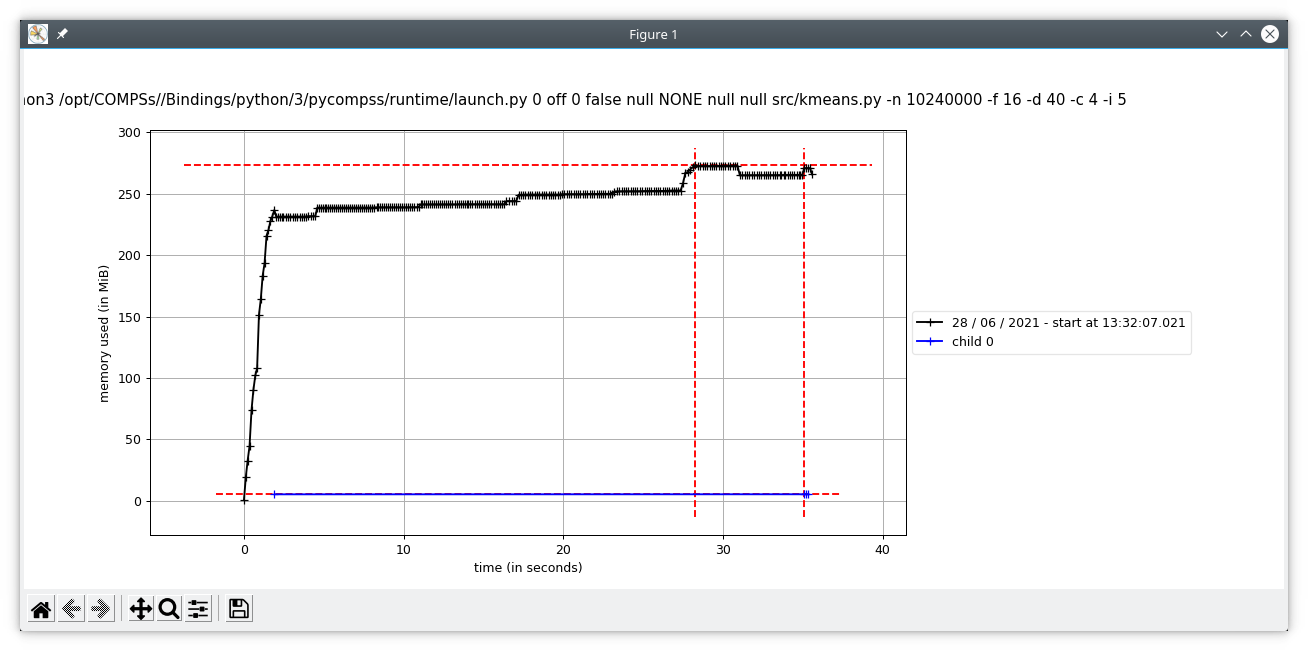
Figure 67 mprof plot example
Advanced profiling
For a more fine grained memory profiling and analysing the workers memory
usage, PyCOMPSs provides the @profile decorator. This decorator is able
to display the memory usage per line of the code.
It can be imported from the PyCOMPSs functions module:
from pycompss.functions.profile import profile
This decorator can be placed over any function:
- Over the
@taskdecorator (or over the decorator stack of a task) This will display the memory usage in the master (through standard output).
- Under the
@taskdecorator: This will display the memory used by the actual task in the worker. The memory usage will be shown through standard output, so it is mandatory to enable debug (
--log_level=debug) and check the job output file from.COMPSs/<app_folder>/jobs/.- Over a non task function:
Will display the memory usage of the function in the master (through standard output).
By default, the @profile decorator reports the memory usage line by line:
Line #    Mem usage    Increment  Occurrences   Line Contents
=============================================================
     7     53.3 MiB     53.3 MiB           1   @task(returns=1)
     8                                         @profile()
     9                                         def increment(value):
    10     61.0 MiB      7.7 MiB           1       a = [1] * (10 ** 6)
    11     83.7 MiB     22.7 MiB           1       b = [2] * (value * 10 ** 6)
    12    312.6 MiB    228.9 MiB           1       c = [3] * (value * 10 ** 7)
    13    289.9 MiB    -22.7 MiB           1       del b
    14    289.9 MiB      0.0 MiB           1       return value + 1
Job name: job10_NEW
Task start time: 1653572135.1119144
Elapsed time: 0.10722756385803223
Initial memory: 8150122496
Final memory: 7759843328
But this information can be reduce to show only the peak memory usage of
each task by setting full_report=False in the @profile decorator
(@profile(full_report=False)). More specifically, the profiling information
reported will be a one-liner per task showing:
The task start time
The task job name
The file that contains the task
The task name
The task elapsed time
The amount of memory used before executing the task
The amount of memory used after executing the task
The peak memory usage
1653572135.1119144 job10_NEW /path/to/increment.py increment 0.10722756385803223 8150122496 7759843328 312.6 MiB
Tip
It is possible to redirect the profiling output to a single file by
exporting the COMPSS_PROFILING_FILE environment variable with the
path to the destination file.
Please, remind that this variable needs to be available in the worker
if the @profile decorator is used to report the memory usage of the
tasks. Consequently, consider the usage of the --env_script flag
in the runcompss command defining a script that exports the
COMPSS_PROFILING_FILE in order to make it available in the workers
in local executions.