Application graph
At the end of the application execution a dependency graph can be
generated representing the order of execution of each type of task and
their dependencies. To allow the final graph generation the -g flag
has to be passed to the runcompss command (alternative flags to the
-g are the --graph or the --graph=true); the graph file is
written in the <BASE_LOG_DIR>/monitor/complete_graph.dot at the end
of the execution (<BASE_LOG_DIR> is usually $HOME/.COMPSs unless
the --base_log_dir=<BASE_LOG_DIR> flag is specified).
Warning
Application graph generation is not supported using agents.
Figure 26 shows a dependency graph example of a SparseLU Java application. The graph can be converted from dot format to pdf format by running the following command:
compss@bsc:~$ compss_gengraph ~/.COMPSs/sparseLU.arrays.SparseLU_01/monitor/complete_graph.dot
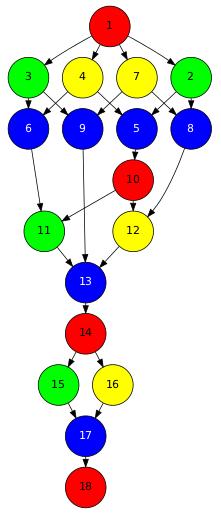
Figure 26 The dependency graph of the SparseLU application
When only the dot file is passed as a parameter, compss_gengraph creates a PDF image file by default,
named complete_graph.pdf. However, a different image format can be selected by specifying any other format
supported by GraphViz. Check the list of supported formats here, and verify
also that they are supported in your system, since not all formats are available for all systems. An example on how
to specify the format would be:
compss@bsc:~$ compss_gengraph svg ~/.COMPSs/sparseLU.arrays.SparseLU_01/monitor/complete_graph.dot
This would generate a complete_graph.svg output file that would contain the application’s workflow image
in Scalable Vector Graphics (SVG) format.